Friday, May 22, 2015
Week 8: May 22, 2015
Week 8 consisted of further testing the prototype and researching a solution for filtering the dye. The idea of using coconut oil was abandoned due additional research. Raw aloe vera that would be readily available on a tropical island is a thick oil that should be capable of capturing the dye. The aloe vera will be obtained in the upcoming week. The filter was also tested using the same conditions as the initial testing. No major alterations had been made to the filter and similar results were expected. A copper solution was poured through the filter first. Like before, the blue tint of the solution was no longer present in the collection container. The particulate solution containing glass beads was also successfully filtered out. The final test involved the nile dye solution. As expected, the red dye was not filtered, leading to a failure for this part of the performance testing. The filter was cleaned by running clear water through it for an extended period of time to get the dye out of the cloth.
Week 7: May 15, 2015
This is the seventh laboratory period for the group. This week followed the prototype testing. The new goal is to determine the issues and failures during the testing and to figure out how to create new solutions to them. The main failure was with the Nile Red organic dye. The first step in figuring out how to filter out the dye is to research it. During this laboratory period the dye was researched and solutions were discussed. It was found that the dye binds to fats and oils due to their lipid composition. The group brainstormed to determine what fats or oils if any would be present on a deserted island. Coconut oil was chosen due to its hypothetical availability and solid nature. The filter was dissected to determine where the dye had absorbed. The cloth at the bottom contained a pink tint, meaning that the cloth had saturated with the dye, causing the filter to fail. The group also discussed adding more cloth to absorb more volume of dye. It was decided that a chemical approach to this problem was the correct one. The filter was cleaned by running clear water through it for a few hours following the lab.
Friday, May 8, 2015
Week 6: Videos of pouring some of the liquids through the prototype
Video 1. Video of the prototype testing during lab period. The pink, organic dye is being poured through the filtration system.
Video 2. Video of the prototype being tested during lab. The blue, copper dye is being poured through the filtration system.
Week 6: Prototype Testing
 |
| Figure 12. Pouring blue copper solution through filter. |
 |
| Figure 13. Pouring the blue copper solution through filter. |
 |
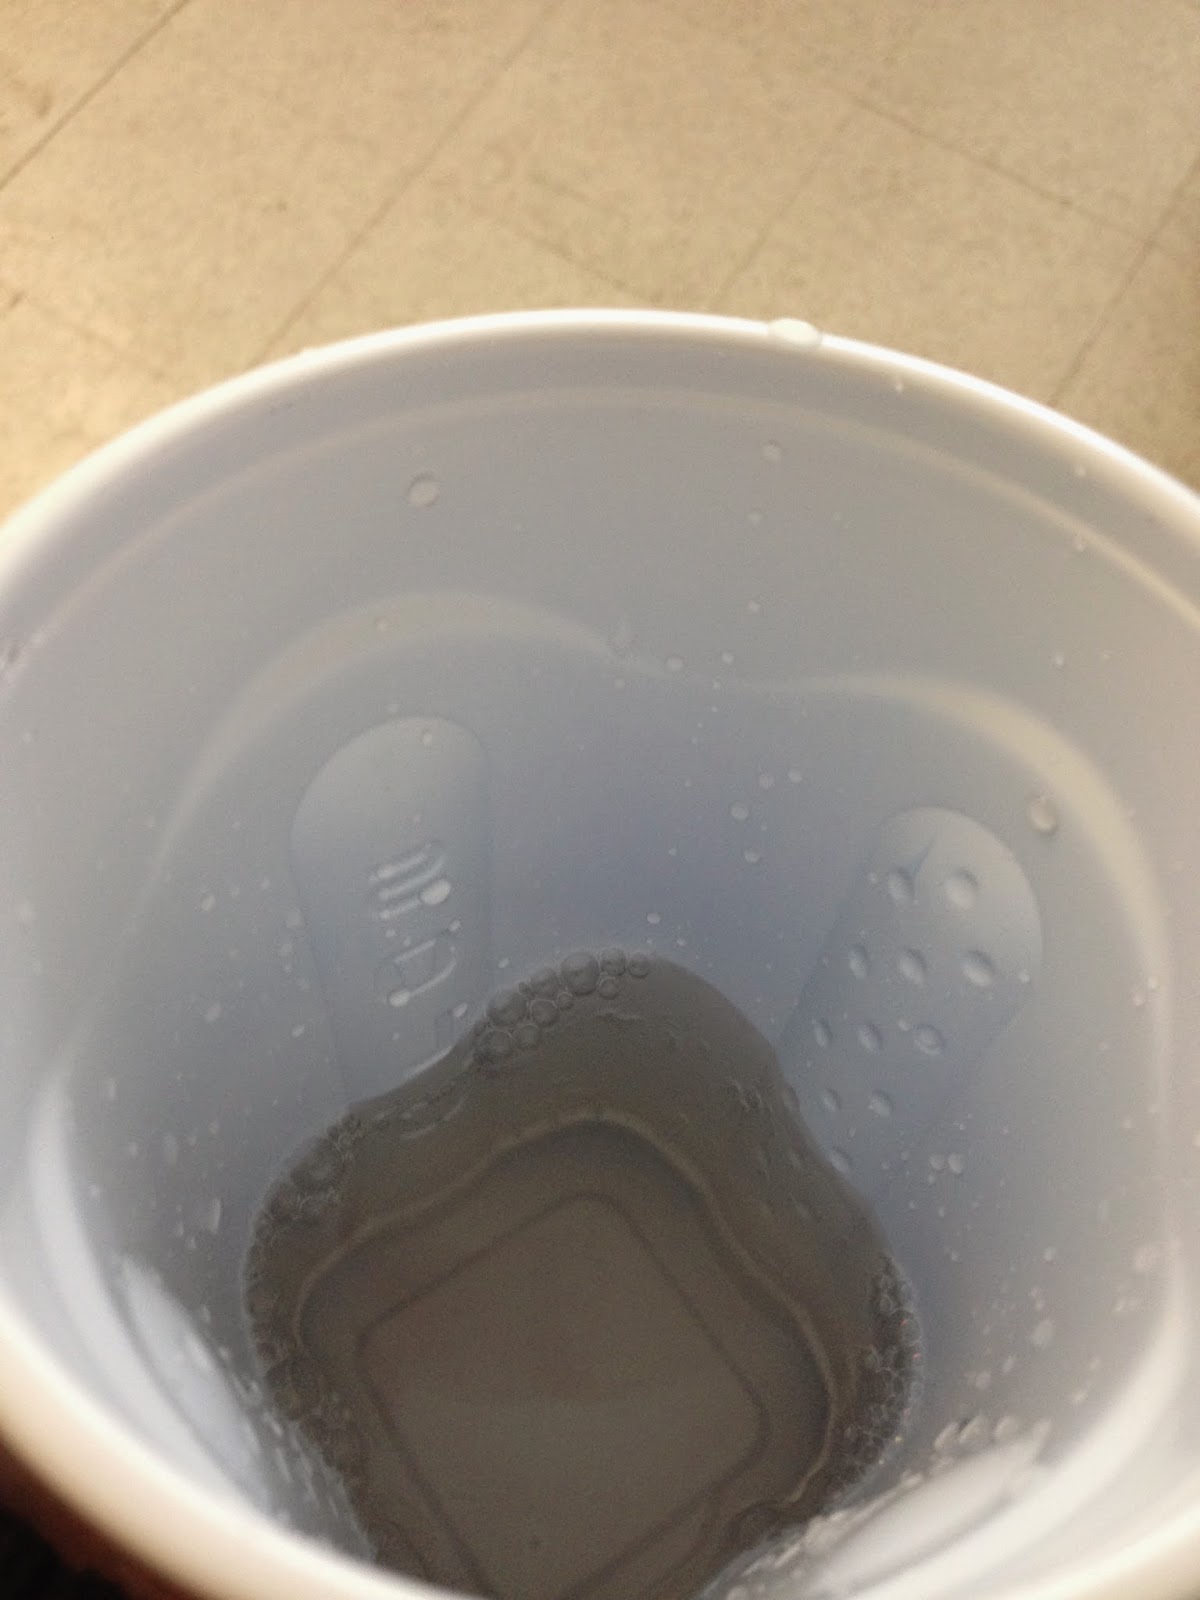
| Figure 14. The color of the filtered copper solution compared to the original. |
 |
| Figure 15. The final color of the filtered copper solution. |
 |
| Figure 16. The organic solution filtering through the prototype. |
 |
| Figure 16. Final color of the organic solution after being filtered through. |
 |
| Figure 17. The final color of the aluminum coated glass spheres after being filtered through. There were no reminants yet the pink dye left over contaminated the system. |
Previous to Week 6: Building of the Prototype
 |
| Figure 12. A picture of Matt putting together the layers of filtration material. |
 |
| Figure 11. A picture of the filtration prototype with charcoal, sand, gravel and cloth, and the resulting color of the water after passed through the filter. |
 |
| Figure 10. Members Jeff and Matt pouring water through the filtration prototype, as the rest of the group looks on. |
Week 6: May 8, 2015
This is the sixth laboratory meeting for group four. Over the past week, between the time of the fifth laboratory meeting and this one, the group has officially tested all four different filtration materials: sand, charcoal, cloth and gravel. This information has been recorded on a data table (below this post) and visualized in a graph (below this post) of the average flow rates. For each material, three different amounts were tested, 20 mL, 60 mL and 100 mL. From there, the amount of water passed through in mL was measured along with the time interval. From those values, the flow rates were able to be calculated and then averaged together. It seemed to be that the charcoal and the cloth has the smallest average flow rates, while the gravel and the sand had higher average flow rates. During the actual laboratory period, three different liquid substances were tested through the filter. The first was a blue copper solution. 100 mL was poured through the system and took a little above 5 minutes for the entire volume amount to be filtered through. The resulting color was a light, faint blue. This means that the filtration system was successful but not 100%. The next solution was a pink organic one. 100 mL was poured through the system and also took 5 minutes. The resulting color was a lighter pink, but still pretty saturated of a color. This means it was successful, but less than the blue. The final substance was an aluminum coated glass sphere substance, still 100 mL. The resulting liquid was still a pink, as a result of the previous dye left over that was poured through. Yet at the end of the 5 minutes, there were no particles left over, meaning that the aluminum was successfully eliminated. As a result, the copper solution was most successful, with the aluminum as well, and the organic being the least successful.
Graph of Data Table
Graph 1. A graph depicting the average flow rates of the four different filtration materials.

Data Table for Filtration Materials
Table 1. The tested data of four different filtration materials for various volumes and calculated flow rates.

Friday, May 1, 2015
Week 5: Pictures
 |
| Figure 9. Group 4 working during Laboratory week 5. |
 |
| Figure 10. The final water coloration after filtering through both sand and charcoal. This still needs to be modified. |
Week 5: May 1, 2015
This is the fifth laboratory meeting period for group 4. Over this past week, the group has been able to acquire sand. So, this period the sand was tested. So in the same way the charcoal was tested last week, the sand was tested this week. Using the same cotton T-shirt fabric, a round "sac" was cut and put together. The sand was then placed inside this "thylakoid sac" and placed in a cup with holes. The sand was made into a thylakoid sac. In a cup, the sand sac and the charcoal sac was placed, and water was ran through the cup, through the sacks and pushed down with the pre-existing prototype pump, the results were undermining. The resulting water turned out to be more dirty and discolored than it began as. The group then began to wonder if sand was not a proficient of a substance as thought. A possible reasoning is that there is dye in the sand, causing the discoloration. However, it was later figured out that it was the charcoal that was causing the discoloration. The sand was re-tested multiple times, and resulted in fairly perfectly clear water. However, when paired with the charcoal, the water becomes discolored to a black color. It is mostly likely that the T-shirt is too porous and too much ash from the charcoal is coming through. For a good amount of time, the sac of charcoal was watered down and through, and re-tested with sand. The color was lighter this time. The issue is that charcoal breaks down with the inclusion of water. The solution is a less porous sac material to not let charcoal ash out. The resulting color of the water is shown in a picture following this blog. For next laboratory period, the group will gather a better material to hold the substance, such as an athletic fabric T-shirt. Also, for next laboratory period, the pump system will be modified because it is found to be not strong enough for multiple trials.
Subscribe to:
Comments (Atom)